Deep learning has significantly advanced the field of building extraction from remote sensing images, providing robust solutions for identifying and delineating building footprints. However, a major challenge persists in the form of domain adaptation, particularly when addressing cross-city variations. The primary challenge lies in the significant differences in building appearances across cities, influenced by variations in building shapes and environmental characteristics. Consequently, models trained on data from one city often struggle to accurately identify buildings in another city. In this paper, we address this challenge from a data-centric perspective, focusing on diversifying the training set. Our empirical results show that improving data diversity via open-source datasets and diffusion augmentation significantly improved the performance of the segmentation model. Our baseline model, trained with no extra dataset, only achieved a private F1 score of 0.663. On the other hand, our best model, trained with the additional Las Vegas building footprints extracted from the Microsoft Building Footprint dataset, achieved a high private F1 score of 0.703. Surprisingly, we found that diffusion augmentation helps improve our model score to 0.681 without requiring an extra dataset, which is higher than the baseline model. Finally, we also experimented with the Non-Maximal Suppression (NMS) hyperparameter to improve the model’s performance in segmenting dense and small objects, which gave us a high private F1 score of 0.897. Our source code and the pretrained models are publicly available at https://github.com/DoubleY-BEGC2024/OurSolution.
1. Objective: This competition embarks on this challenge by utilizing a building footprint dataset from the Tokyo area as the primary training set, with plans to extend testing to other Japanese regions. This approach aims to inspire the development of models with robust generalization capabilities, capable of overcoming the hurdles of automatic building footprint detection and extraction across various landscapes. Overcoming this challenge signifies the creation of a novel approach for efficient, cost-effective, and precise building footprint extraction at a national level with minimal regional data, showcasing its potential applicability worldwide.
2. Mandatory Training Data: The training set data uses 0.3-meter Google earth satellite images complemented by meticulously manually annotated building outlines. A total of 4717 images are provided, where all of them are extracted within Tokyo vicinity. The training data was divided into a training set and a validation set with a ratio of 8:2.
3. Mandatory Test Data: The imagery and building annotations for both test sets derive from the open-source Japanese 3D city model, the Plateau project (https://www.mlit.go.jp/plateau/) enhanced with manual adjustments following visual inspection. All test images were randomly selected from 42 cities in Japan, but a balance of different types of areas was maintained. A total of 250 images were taken from each region, totaling 1,000 images.
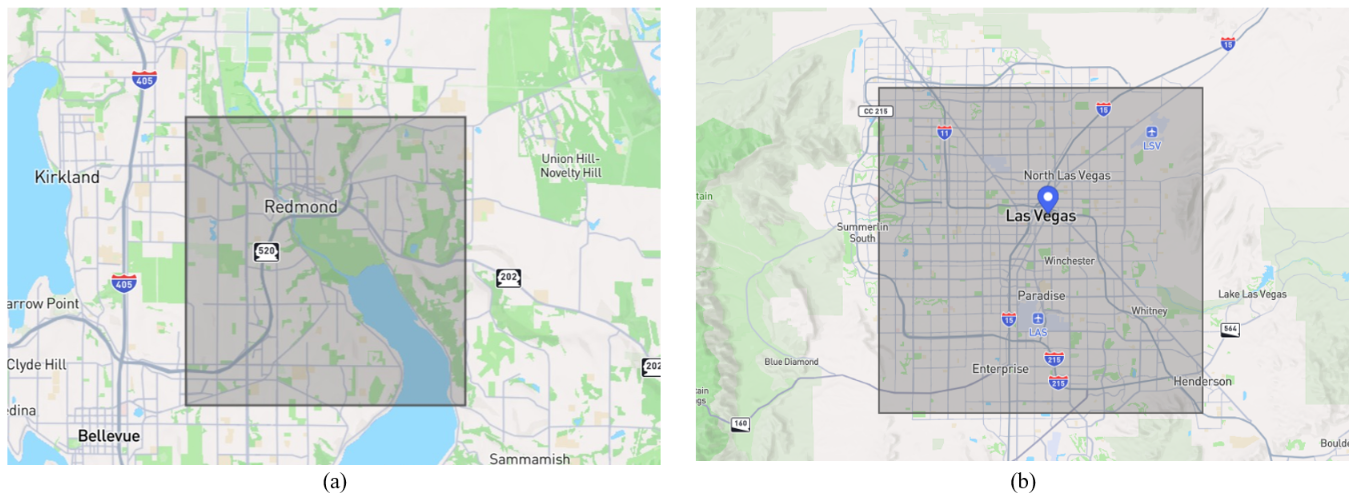
Figure 1: The region of interest for the building footprints extracted from the Microsoft Building Footprint (BF) dataset. (a) Redmond, Washington. (b) Las Vegas, Nevada. For simplicity's sake, we refer the former as Redmond dataset, and the latter as Las Vegas dataset.
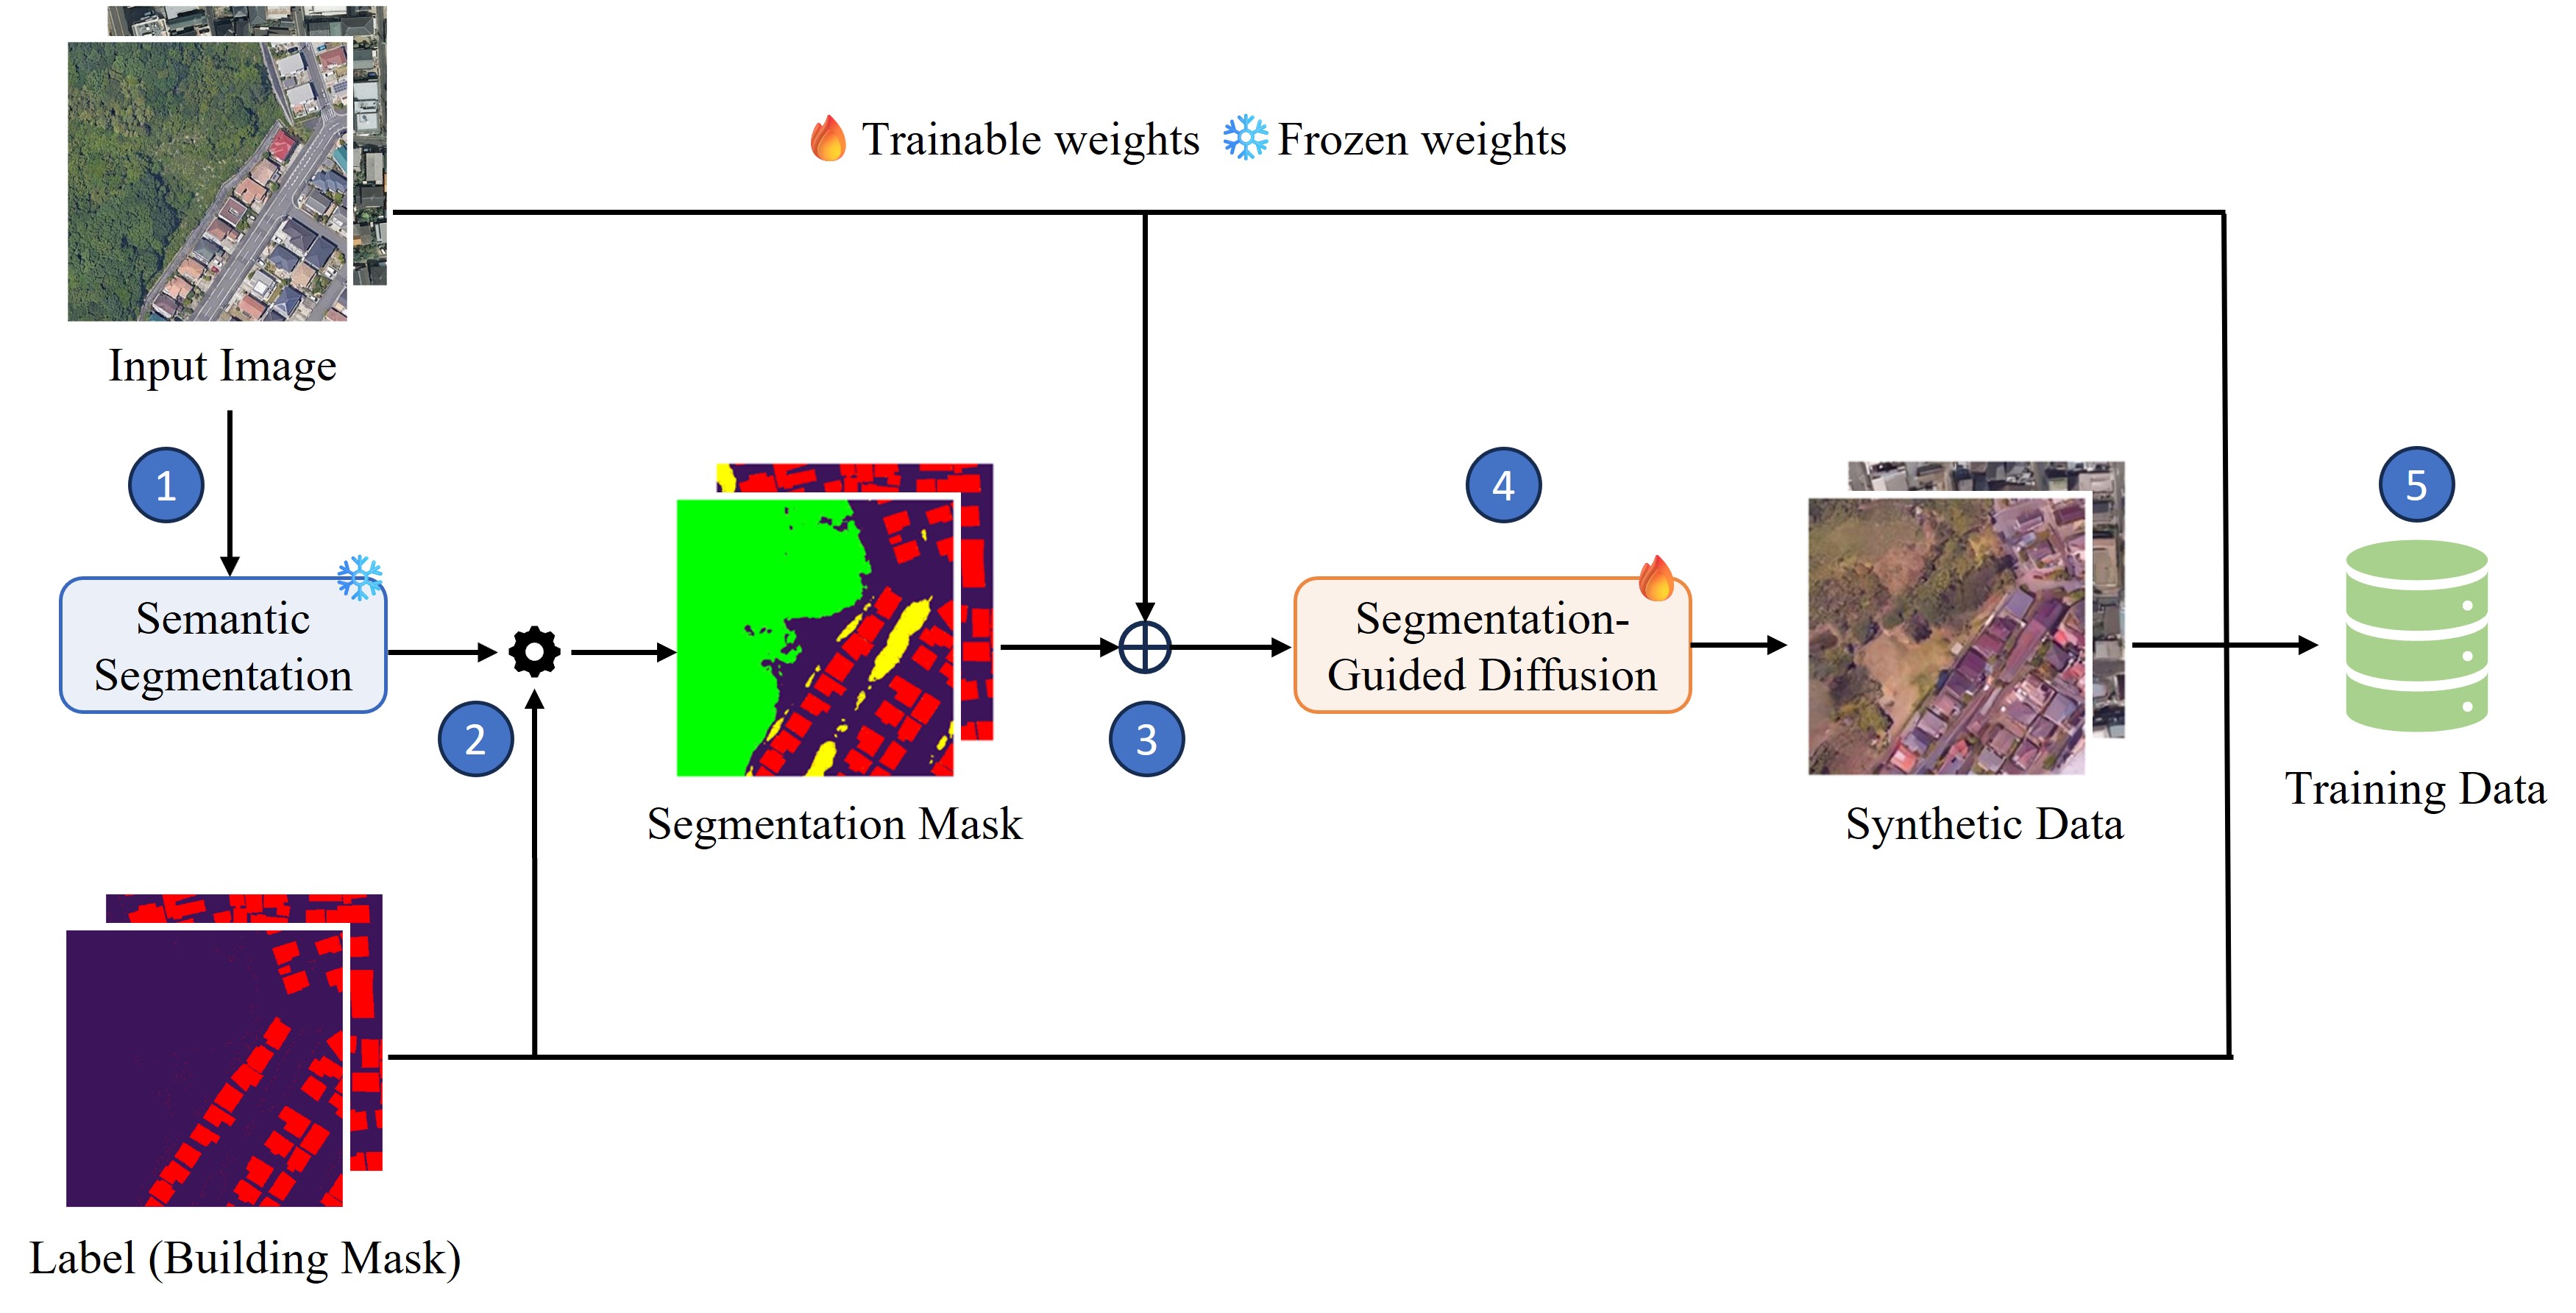
Figure 2. The proposed diffusion augmentation pipeline. (1) Use pretrained segmentation model to generate semantic segmentation. (2) Refine the segmentation mask using the building polygon labels. (3) Concatenate input image with the semantic mask. (4) Train the segmentation-guided diffusion model using the concatenated inputs.
YOLOv8 series comes with several instance segmentation models, ranging from the smallest nano (n) variant to the largest extra-large (x) variant. We performed several experiments to select the best YOLOv8 variant for our task, considering both the F1 score and model complexity, as shown in Table I. Additionally, we compared the performance of YOLOv8-based instance segmentation models with other state-of-the-art models, including YOLOv9, Mask R-CNN, and EfficientNet. All models are trained for 50 epochs with 640 image size. During test time and submission, the confidence and NMS IoU thresholds are set as 0.20 and 0.70, unless stated otherwise. We also tested the F1-score of the models with a confidence threshold of 0.50, primarily to evaluate how confident the models are rather than for actual submission.
| Model | Pretrained Weights | Batch Size | Params (M) | FLOPs (G) | Public F1-Score | |
|---|---|---|---|---|---|---|
| Conf = 0.50 | Conf = 0.20 | |||||
| YOLOv8n-seg | DOTAv1 Aerial Detection | 16 | 3.4 | 12.6 | 0.510 | 0.645 |
| YOLOv8s-seg | 16 | 11.8 | 42.6 | 0.535 | 0.654 | |
| YOLOv8m-seg | 16 | 27.3 | 110.2 | 0.592 | 0.649 | |
| YOLOv8x-seg | 8 | 71.8 | 344.1 | 0.579 | 0.627 | |
| YOLOv9c-seg | COCO Segmentation | 4 | 27.9 | 159.4 | 0.476 | 0.577 |
| Mask R-CNN (MPViT-Tiny) | 4 | 17 | 196.0 | - | 0.596 | |
| EfficientNet-b0-YOLO-seg | ImageNet | 4 | 6.4 | 12.5 | - | 0.560 |
Our observations:
We experimented with the performance of YOLOv8m-seg by varying the training dataset, as shown in table below:
| Setup | Dataset | Public F1 Score |
|---|---|---|
| A | BEGC 2024 | 0.649 |
| B | BEGC 2024 + Redmond Dataset | 0.660 |
| C | BEGC 2024 + Las Vegas Dataset | 0.686 |
| D | BEGC 2024 + Diffusion Augmentation | 0.672 |
| E | BEGC 2024 + CutMix Dataset | 0.650 |
Our observations:
We compare our solutions with the 2nd and 3rd place in the leaderboard:
| Solution | FLOPS (G) | F1-Score | |
|---|---|---|---|
| Public | Private | ||
| YOLOv8m-seg + BEGC 2024 | 110.2 | 0.64926 | 0.66531 |
| YOLOv8m-seg + BEGC 2024 + Redmond Dataset | 0.65951 | 0.67133 | |
| YOLOv8m-seg + BEGC 2024 + Las Vegas Dataset | 0.68627 | 0.70326 | |
| YOLOv8m-seg + BEGC 2024 + Diffusion Augmentation | 0.67189 | 0.68096 | |
| 2nd place (RTMDet-x + Alabama Buildings Segmentation Dataset) | 141.7 | 0.6813 | 0.68453 |
| 3rd Place (Custom Mask-RCNN + No extra Dataset) | 124.1 | 0.59314 | 0.60649 |
Our observations:
Non-maximal suppression (NMS) can be less effective at detecting small, densely packed objects, as it relies on IoU to suppress overlapping bounding boxes. In scenarios involving small and dense objects, the bounding boxes often overlap significantly, which can lead to the suppression of true positives. We can mitigate this issue by increasing the IoU threshold in the NMS layer to prevent unnecessary reduction of bounding boxes. We experimented by increasing the IoU threshold in the NMS layer of YOLOv8m-seg from the default 0.70 to 0.95, with increments of 0.05.
| Dataset | Private F1 Score (using different NMS IoU Threshold) | |||||
|---|---|---|---|---|---|---|
| 0.70 | 0.75 | 0.80 | 0.85 | 0.90 | 0.95 | |
| BEGC2024 + Redmond Dataset | 0.672 | 0.677 | - | - | 0.748 | 0.866 |
| BEGC2024 + Las Vegas Dataset | 0.703 | 0.693 | 0.686 | 0.721 | 0.766 | 0.897 |
| BEGC2024 + Diffusion Augmentation | 0.681 | - | 0.694 | 0.711 | 0.751 | 0.887 |
Our observations:
1. Dataset quality is what you need: There are 2 observations from our study. Firstly, data diversity is important to mitigate the generalization challenge. For instance, Las Vegas dataset offers higher diversity (i.e., desert backgrounds, different building shapes) as compared to the Redmond dataset, which is semantically more similar to the provided BEGC2024 training set. Hence, the performance of our model trained with BEGC2024 + Las Vegas dataset is better than BEGC2024 + Redmond dataset.
2. Diffusion Augmentation is label-efficient: Diffusion augmentaion is what you need if you do not have extra dataset which is diverse enough from the original training set. For instance, the Redmond dataset is not as useful as the Las Vegas dataset. However, it might be difficult and/or costly to find out the suitable extra dataset. On the other hand, we do not need extra dataset to prepare our diffusion augmentation pipeline. Even better, BEGC2024 + Diffusion Augmentation outperforms BEGC2024 + Redmond dataset, and also outperforms the 2nd and 3rd place entrants!
3. Start with a small model: We recommend starting with a smaller model. It is unwise to use a larger model when dealing with a limited dataset, as it may lead to overfitting. Our empirical study agrees with this hypothesis, as we failed to achieve a high mAP score using the biggest YOLOv8 version (YOLOv8x-seg). Given more time, we would explore training YOLOv8x-seg with all the extra datasets we gathered, and also using our diffusion augmentation pipeline.
![]()
![]()
![]()
![]()